
What is a marketing report?
A marketing report is a fixed-period summary of what marketing did, what it produced, and what happens next. It is not a data dump. The distinguishing feature of a good one is that a reader who was not in the room can finish it and know which decision to make.
That framing matters because it determines what goes in. If the report exists so a chief marketing officer can decide whether to move budget between channels, the budget and return section is the report and the social engagement rate is a footnote. If it exists so an agency can show a client the work is working, the funnel and the attributed revenue carry it. Pick the decision first; the metrics follow.
The seven elements of a marketing report template
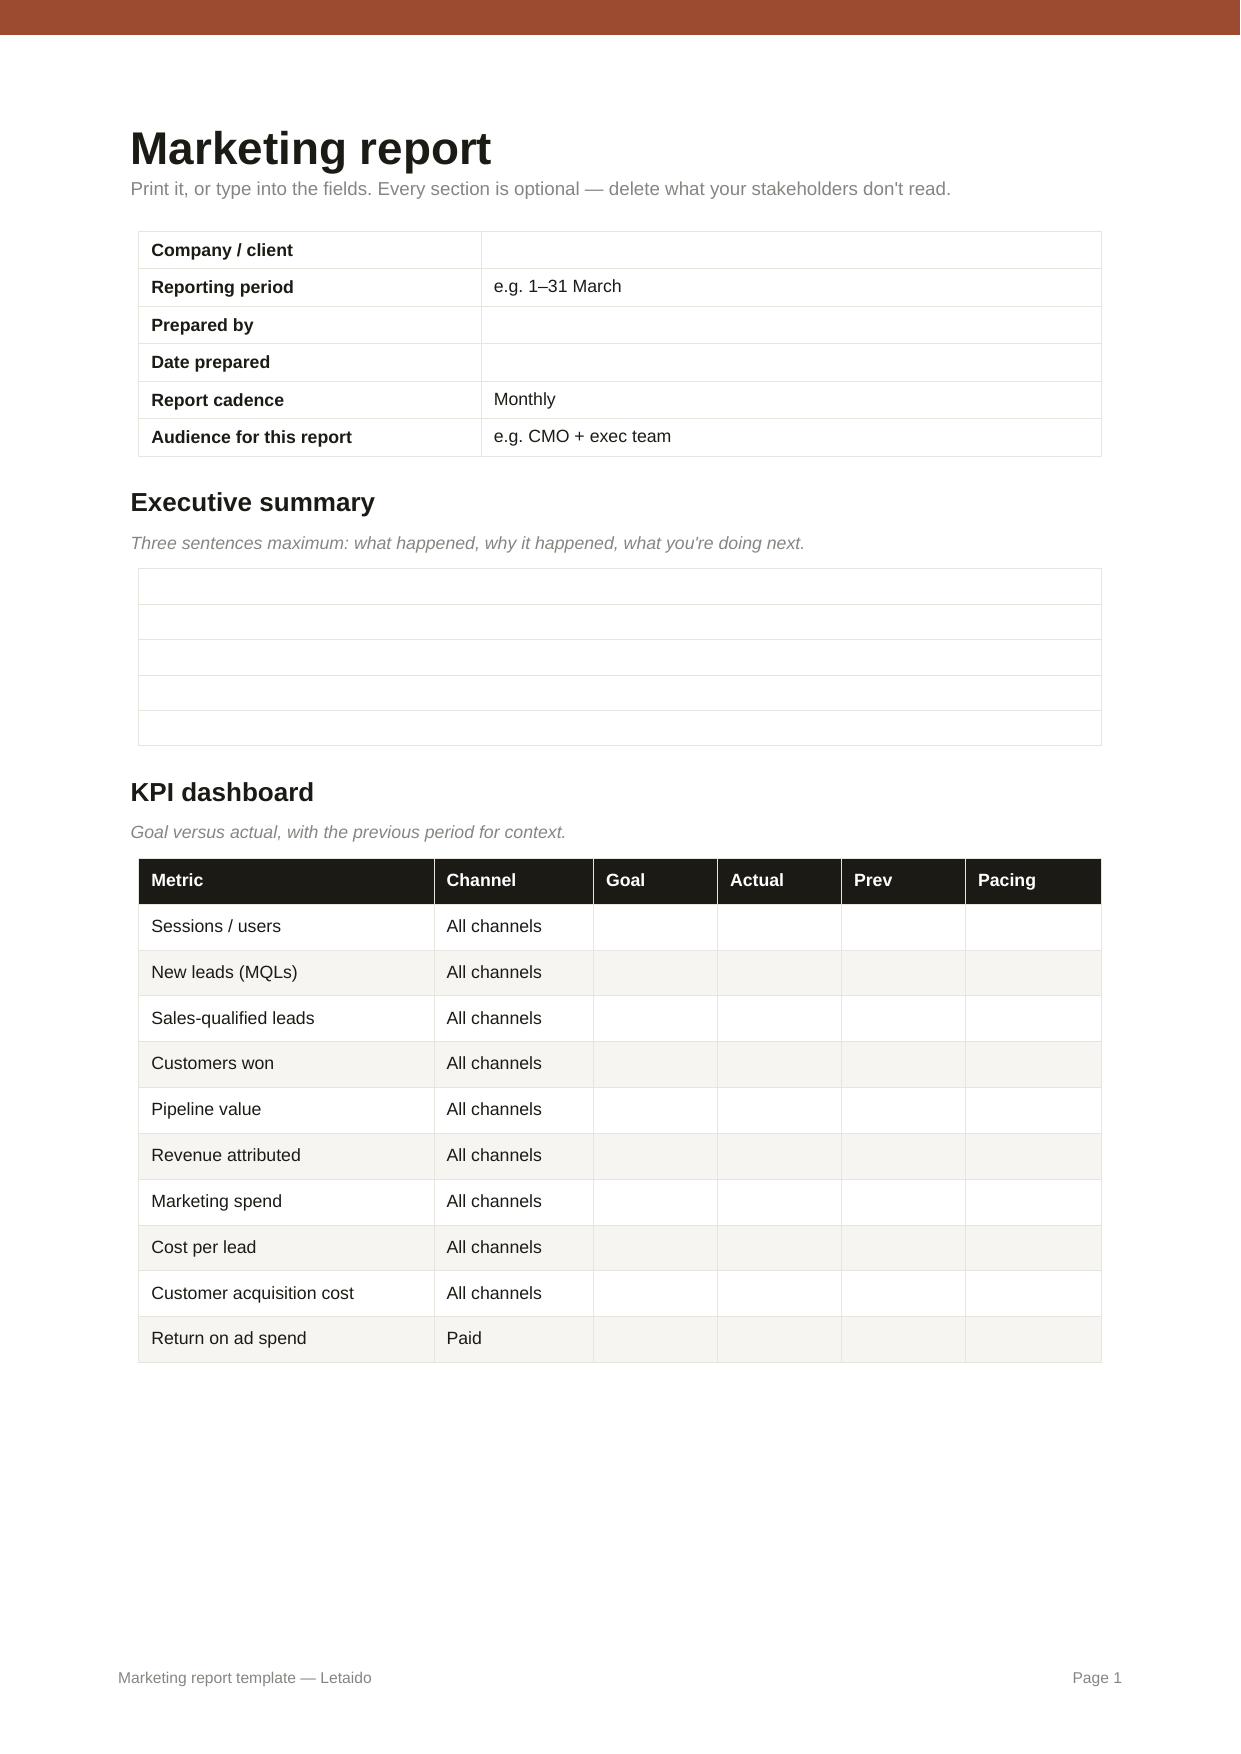
Almost every useful marketing report contains the same seven components. The template above implements each one as its own tab.
1. Executive summary
Three sentences: what happened, why it happened, what you're doing next. Write it last, after you know what the data says. If you cannot compress the period into three sentences you have not finished analysing it.
2. Goals and key performance indicators
Every number needs a goal beside it, set at the start of the period, not retrofitted at the end. A metric without a target is trivia — “14,000 sessions” means nothing until you know whether you were aiming for 10,000 or 30,000. Goal pacing (actual divided by goal) is the single most useful column in any report, which is why the template colour-codes it automatically.
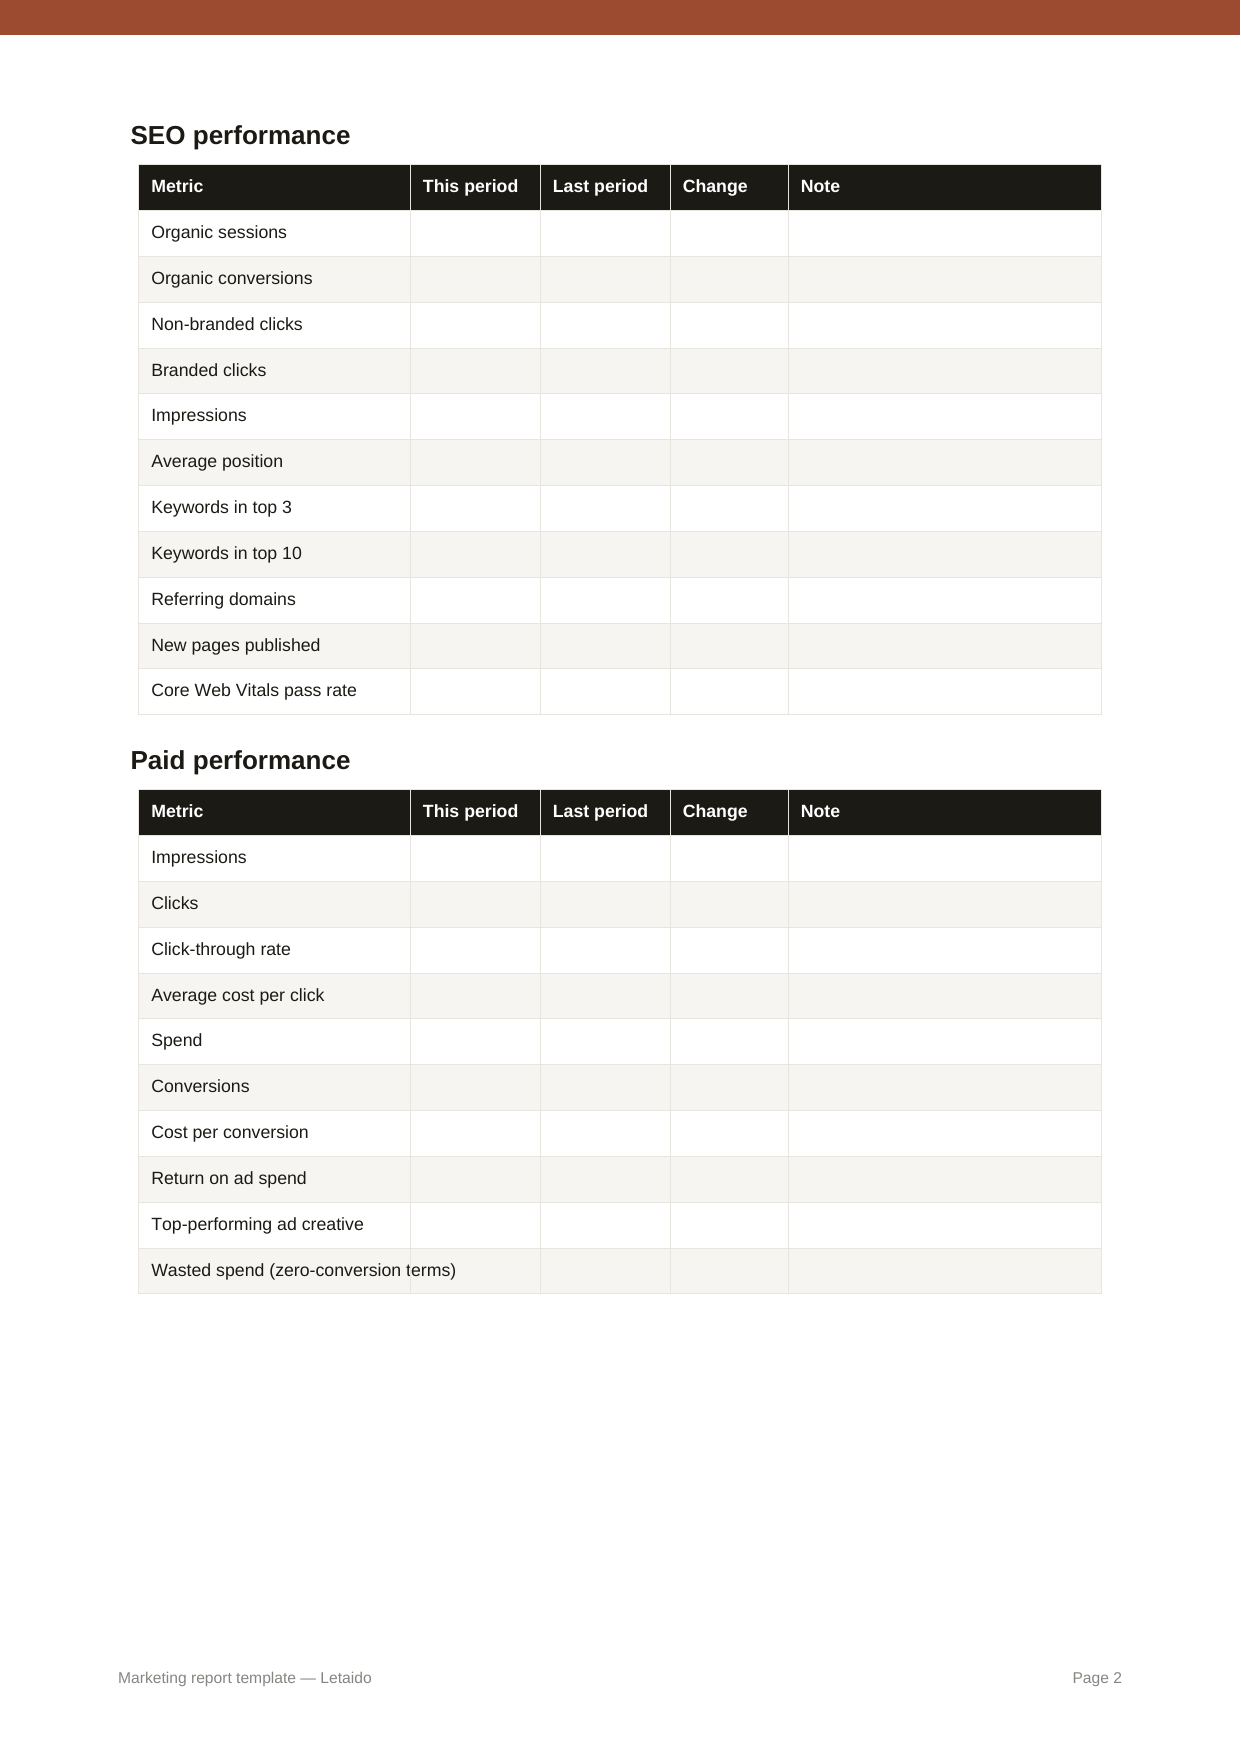
3. Channel breakdowns
One tab each for SEO, paid, social, email and website analytics. Keep the channel detail behind the summary, not in front of it: readers who want it will go looking, and readers who don't shouldn't have to scroll past it.
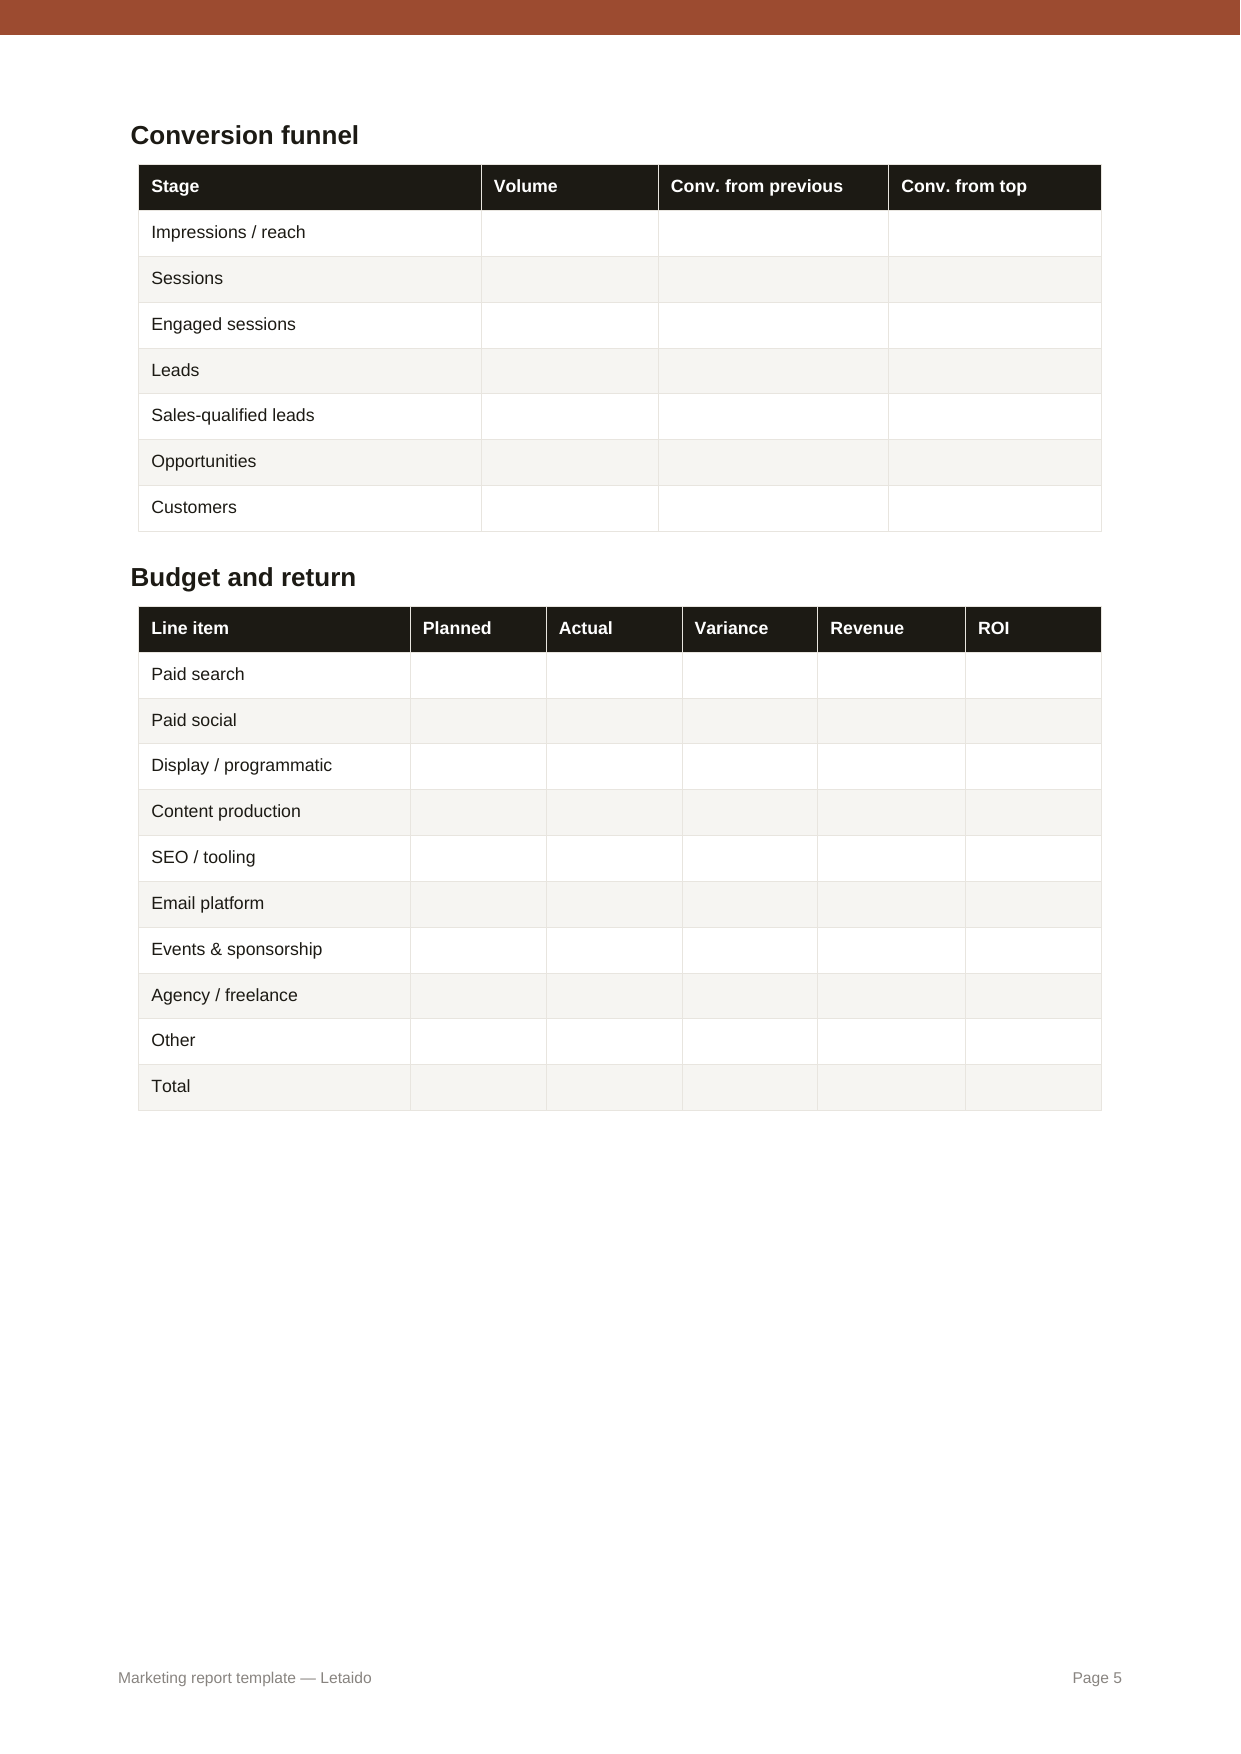
4. Conversion funnel
Volume at each stage, from impressions through sessions and leads to closed customers. The value is not the volumes, it's the conversion rate between adjacent stages — that's what identifies where the loss is happening. A campaign that doubles traffic while lead conversion halves has achieved nothing, and only a funnel view makes that visible.
5. Budget and return
Planned versus actual spend per line item, with revenue attributed and return on investment calculated per line. Include it even when the numbers are unflattering. Reports that only surface spend when it looks good stop being believed.
6. Insights
The section that separates a report from an export. Four questions, honestly answered: what worked, what didn't, why the numbers moved, and what you're doing about it. “Why” is where most reports fail — they restate the number (“organic traffic fell 12%”) instead of explaining it (“organic traffic fell 12% because a core update hit our comparison pages; the three affected URLs are being rewritten this month”).
7. Next actions
Specific action, named owner, due date, expected impact. Without an owner and a date, an insight is an observation. This is also what makes the next report easy to write — you open with whether last period's actions landed.
Types and formats of marketing report template
“Marketing report template” covers several different documents that get used for different jobs. Picking the wrong type is the most common reason a report doesn't land.
| Type | What it's for | Best format |
|---|---|---|
| Monthly marketing report | The standard recurring report to executives or a client. Goals, channels, funnel, spend, next actions. | Excel or Google Sheets for the working file; PDF to send |
| Marketing performance dashboard | A live view of the same metrics, always current, no commentary. Sits alongside the report rather than replacing it. | Looker Studio, or a dashboard tool connected to your sources |
| Digital marketing campaign report | One campaign, start to finish: spend, reach, ad creative performance, conversions, and whether it hit its objective. | Slides — PowerPoint or Google Slides — for a debrief meeting |
| Digital marketing audit report | A one-off diagnostic rather than a period summary. Findings, severity, recommended fixes. | PDF or a document, with an issue table |
| Channel report | A single channel in depth — an SEO report template, a PPC report template, a social media report template, an email marketing report template, an ecommerce report. | One tab of the workbook above, extracted |
| Website analytics report | Traffic, engagement and conversion behaviour on site, independent of which channel drove it. | Google Analytics 4 export, or the Website tab above |
On file formats specifically: a spreadsheet (Excel or Google Sheets) is the right home for the working version, because the calculations live in it and you can trace any number back. A PDF is the right thing to send, because it can't be accidentally edited and it prints. Google Slides or PowerPoint suits a report you're going to present rather than circulate — one point per slide, no tables of 40 rows. And a CSV or Markdown version matters when the report needs to feed something else: a warehouse, a Looker Studio data source, or an AI assistant you want to ask questions of.
What to report per channel
The channel tabs are pre-filled with the metrics that survive scrutiny. Delete freely — a shorter report that gets read beats a complete one that doesn't.
| Channel | Report these | Where the data lives |
|---|---|---|
| SEO | Organic sessions and conversions, branded vs non-branded clicks, impressions, average position, keywords in the top 3 and top 10, referring domains, pages published | Google Search Console, Google Analytics 4, Ahrefs |
| Paid search & social | Impressions, clicks, click-through rate, cost per click, spend, conversions, cost per conversion, return on ad spend, wasted spend on zero-conversion terms | Google Ads, Meta Ads Manager, LinkedIn Campaign Manager |
| Organic social | Net new followers, posts published, impressions, engagement rate, link clicks, referral sessions, top post, share of voice | Native platform analytics, your scheduling tool |
| List growth net of unsubscribes, open rate, click-through rate, click-to-open rate, conversions, revenue attributed, deliverability | Your email service provider | |
| Website | Sessions, users, new vs returning, engagement time, bounce rate, top landing and exit pages, conversion rate, device split | Google Analytics 4, or a privacy-first analytics tool |
Two notes on metrics that get misused. Open rate has been unreliable since Apple's Mail Privacy Protection began pre-loading images — treat it as directional and lead with click-through rate. And average position in Search Console is an average across every query and page; a shift of a tenth of a point usually reflects which long-tail queries you newly appeared for, not a ranking change on anything you care about.
One split is worth adding to any SEO section: branded versus non-branded queries. Branded organic traffic mostly measures how well the rest of marketing is working — a PR hit or a TV campaign raises it. Non-branded organic traffic is the part SEO actually earned. Reporting them as one number lets a brand-driven quarter disguise flat organic visibility, and lets a genuinely good quarter of SEO work look mediocre when brand demand dips. Search Console will filter this for you; the SEO tab above has a row for each.
How often should you report?
| Cadence | Audience | Purpose |
|---|---|---|
| Weekly | The marketing team | Operational. Pacing against the month's goals, campaigns in flight, anything on fire. Short — a dashboard screenshot and three bullets. |
| Monthly | Executives, clients | The main event. The full template: performance against goal, channel detail, funnel, spend, and the decisions you need. |
| Quarterly | Leadership, the board | Strategic. Trends rather than months, budget reallocation, what you're stopping and starting next quarter. |
Daily reporting is nearly always a mistake. Day-level marketing data is dominated by noise — one large referral, one ad approval delay — and reacting to it produces churn rather than improvement. The exception is a live campaign with meaningful daily spend, and even then a dashboard serves better than a report.
How to fill in the template
Budget about 45 minutes for the first one and 20 for each after, assuming your data sources are already connected.
- Set the period and audience on the Summary tab before touching data. Naming the reader changes what you keep.
- Fill the Goal column on the KPI dashboard. If no goals were set for the period, set them now for next period and note the gap honestly.
- Pull channel data into tabs 3–7. Use the same date range everywhere — mismatched ranges are the most common reason two numbers in a report disagree.
- Enter funnel volumes on tab 8. The conversion percentages fill themselves in; read down the column for the biggest drop.
- Reconcile spend on tab 9 against what finance has, not against what the ad platforms report. They differ, and finance's number is the one you'll be asked about.
- Write the insights last, then compress them into the executive summary at the top. The summary is a conclusion, so it can only be written after the analysis.
Where a template stops helping
A downloadable template solves the structure problem and nothing else. It gives you an agreed set of fields, and that is genuinely most of the battle the first month. By month four the limitations are the whole story:
- Fixed fields. The template ships with the metrics we chose. Yours are different, so you edit the file — and then you edit your edit when a channel is added.
- Manual entry. Someone opens five platforms, copies numbers into cells, and hopes the date ranges matched. This is where reporting errors come from, and it's typically a half to a full day a month.
- It's stale on arrival. A spreadsheet is a snapshot. By the time it's read, the numbers have moved, and nobody can drill into anything.
- It doesn't interpret. The insight section is still a blank box. The template can't tell you why organic conversions fell.
The usual escalation path is a reporting system: connect your data sources once, build customizable dashboards with visual breakdowns across multiple channels, set custom rules for what's flagged, and let client-ready reports generate on a schedule. Looker Studio does this free if you're willing to build it; the dedicated tools do it faster and cost more. Either way you trade a day of manual entry for real-time automation.
What none of those solve is the last mile — the report still arrives as charts, and a human still has to write what it means and what to do. That's the specific gap Letaido is built for: an AI teammate that pulls the data, rebuilds the template around your business when it changes, and drafts the insight and next-actions sections for you to approve.
Five mistakes that make reports get ignored
- Reporting activity instead of outcomes. “Published 12 blog posts” is an input. “Published 12 posts; organic sessions to those pages reached 4,100 in month one” is a result. Nobody outside marketing cares about the input.
- No comparison. A number with no goal and no previous period cannot be judged. Every metric in this template has both columns for exactly that reason.
- Restating instead of explaining. If a paragraph only says in words what the table already says in numbers, delete it and write the cause instead.
- Changing the metrics each month. Swapping in whichever numbers look good destroys trust and makes trends impossible. Fix the set; change it deliberately and say so.
- No decision requested. End with what you need from the reader — budget, a sign-off, a hiring decision. A report that asks for nothing rarely gets read twice.
Best practices worth stealing
- Lead with the goal pacing section, not the traffic chart. Readers want to know whether you're on track before they want to know the detail.
- Keep the metric set stable and version the changes. When you do add or drop a metric, say so in the report rather than letting a table silently change shape.
- Show audience demographics and device-level performance only when they change a decision. They're interesting; they're rarely actionable. Put them in an appendix tab.
- Add a recommendation section, not just a summary. The summary says what happened; the recommendation says what you propose to do with the next period's budget.
- Use the same date range everywhere, and state it. “Last 30 days” in one tool and “last calendar month” in another is the most common source of two numbers disagreeing.
- Attach the funnel visualization to the ask. If you want budget for mid-funnel content, the funnel view showing the drop-off is the argument.
- Send it to a named list on a fixed date. A report with no recipients and no schedule quietly stops being produced within a quarter.